Why are trading indicators (like RSI and MACD) lagging? Because they are mathematically designed to look backwards. An indicator is a derivative of past price data. It must wait for a specific number of candles (usually 14) to close before it can calculate a new value. In the 1-minute timeframe of crypto scalping, waiting for 14 minutes of data is not “confirmation” — it is an eternity. By the time the indicator signals “Go,” the move is mathematically over.
We have all been there. You watch a YouTube tutorial. The “guru” tells you: “Wait for the RSI to cross 30, and the MACD to turn green.” You open your chart. You wait. The RSI crosses 30. You buy. And immediately, the price drops. You think the market is rigged. You think the exchange is hunting your stop-loss. But the truth is simpler: You arrived late to the party.
Here is the cold, hard math of why indicators are killing your gains on high-velocity charts.
1. The Math of “The Rearview Mirror”
Let’s look at the formula for the most popular indicator, the RSI (Relative Strength Index). Its default setting is 14 periods. On a 1-minute chart, that means the RSI is calculating the average gain/loss of the last 14 minutes.
Think about that. In Solana scalping, a trend can start, peak, and reverse in 45 seconds. Your indicator is averaging data from 14 minutes ago to tell you what to do now. It is like trying to drive a Formula 1 car while only looking at the rearview mirror. You will see the curve perfectly — after you have already crashed into the wall.
2. The “Death Zone” Latency
We call the gap between the Price Move and the Indicator Signal the “Death Zone.”
Let’s break down a typical scalp trade:
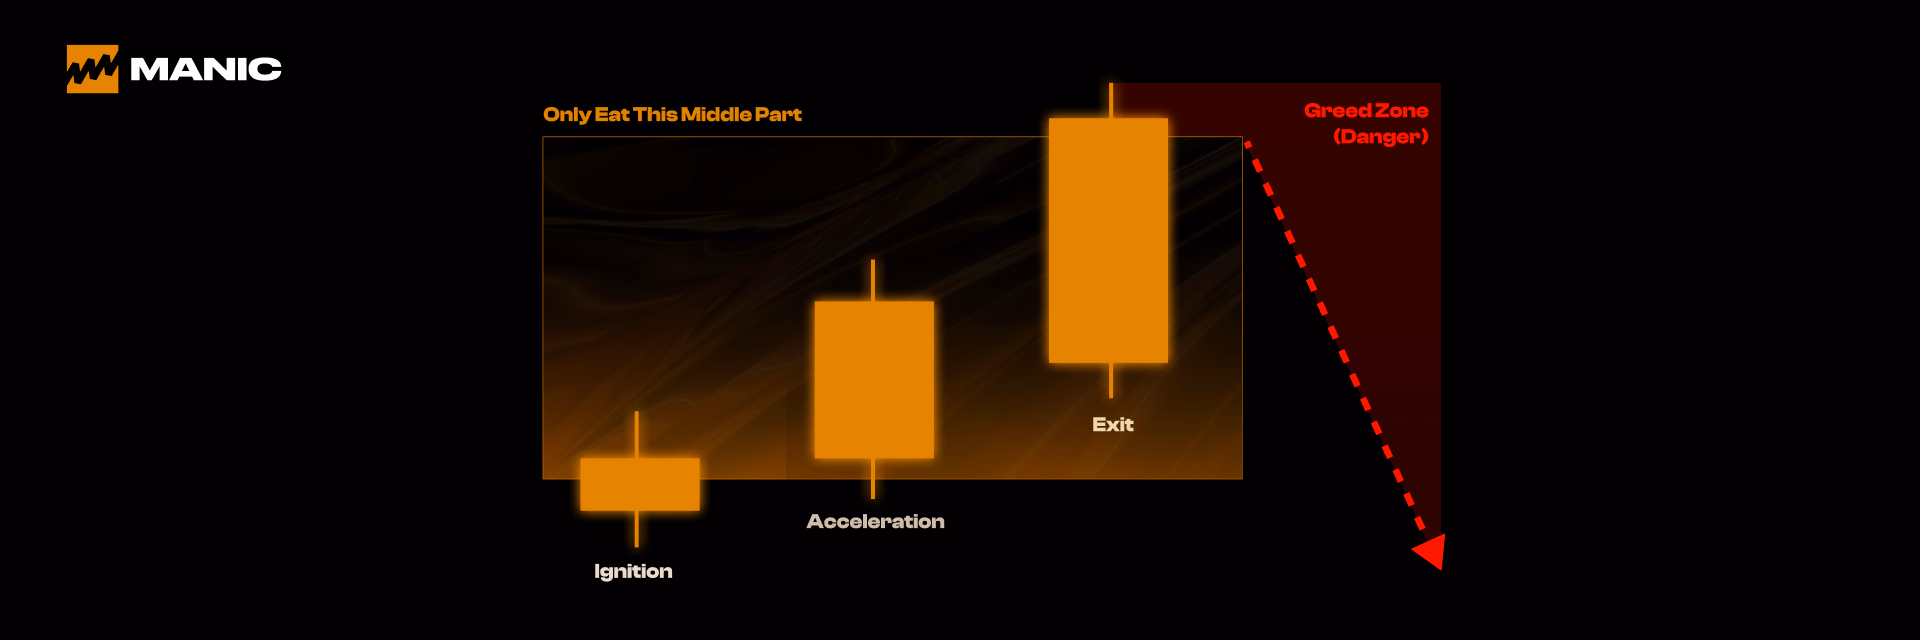
- 00:01 — A massive buy order hits. Price shoots up green. (The Visual Trader enters here).
- 00:03 — The candle is still forming. The RSI line starts to curve up slowly.
- 00:15 — The price hits resistance and starts to slow down.
- 00:20 — The 14-period average finally catches up. The RSI crosses the “70” line signalling “Overbought.”
- 00:25 — The indicator trader sees the signal and clicks.
Do you see the problem? The Visual Trader entered at 00:01. The Indicator Trader entered at 00:25. In that 24-second gap, the easy money was already made. The Visual Trader is now selling his bags to you, the Indicator Trader.
Contextual Link: This is why we focus on “Wicks” and real-time rejection. A wick happens instantly; an indicator waits for the close. Read more on how to spot these instant signals in [The “Wick” Betrayal].
3. Naked Trading: The Only Zero-Lag Tool
If indicators are broken, what is the solution? Delete them. This is called “Naked Trading” or “Price Action Trading.” The only indicator with Zero Lag is the price itself.
When you strip away the messy lines, clouds, and oscillators, you free up your Cognitive Bandwidth.
- Instead of calculating if the RSI is at 68 or 72, you simply ask: “Is the green candle getting bigger or smaller?”
- Instead of waiting for a MACD crossover, you simply ask: “Did the price just break the previous high?”
4. Manic Trade was Built for “Naked” Speed
We built Manic Trade because we were tired of “heavy” charts. Traditional exchanges (CEXs) give you 50+ indicators because they want you to feel smart. They want you to feel like an analyst. But analysts don’t make money in 60-second trades. Reactors do.
On Manic, the interface is stripped. No RSI. No Bollinger Bands. Just the raw, pulsing heartbeat of the price. It forces you to look at the only thing that matters: Volatility.
Contextual Link: To trade this way, you need to understand the philosophy of Momentum. It’s not about predicting the future; it’s about reacting to the present. Learn more in our guide: [The Art of Momentum Trading].
Conclusion: The Chart is Not the Territory
A map is not the terrain. An indicator is not the market. Every second you spend looking at a squiggly line at the bottom of your screen is a second you are NOT looking at the price. In the high-stakes world of crypto scalping, that split second is the difference between a new high score and a liquidation email.
Trust your eyes. Not the algorithm.
Ready to drop the lag? Experience the speed of naked trading on the fastest interface in crypto.
🌐 Official Website: Manic.Trade
🐦 X (Twitter): @ManicTrade
🎮 Discord: Join the Server
✈️ Telegram: Official Channel
🤖 Glossary: Terms You Need to Know
Lagging Indicator
- Plain English: Tools like RSI or MACD that use old data to draw a line. They are always slower than the current price.
- Why it matters: In fast trading (1-minute charts), they give signals too late to be profitable.
Naked Trading (Price Action)
- Plain English: Trading with a clean chart — no indicators, no overlay lines. Just looking at the green and red candles.
- Why it matters: It removes visual noise and allows for instant (zero-latency) decision-making.
The “Death Zone” (Latency Gap)
- Plain English: The time delay between when the price moves and when your indicator finally tells you it moved.
- Key Stat: In crypto, this gap can be 5–30 seconds, which is enough to turn a winning trade into a losing one.
Leading vs. Lagging
- Leading: Price, Volume, and Order Flow (Real-time).
- Lagging: RSI, MACD, Bollinger Bands, Moving Averages (Calculated from the past).
Related Reading
This article is part of our comprehensive guide: Trading Psychology for High-Frequency Scalping: The Complete Mental Discipline Guide.
Discover why 90% of scalpers fail psychologically, the 5 core mental traps destroying traders, and the architectural solutions that eliminate discipline failure without relying on willpower.
This article is part of our comprehensive guide: Momentum Trading Guide: How to Master Crypto Micro-Trends in 30 Seconds as well.
Discover the 3 types of momentum (news, breakout, continuation), 5 visual patterns with 60%+ win rates, and why Manic.Trade's forced exits capture more profit than "holding for more."