Key Takeaways
- Lag is Mathematical, Not Technical: Every indicator is a derivative of price and time, creating an inherent "time debt" that cannot be eliminated by software alone.
- The Look-Back Trap: Standard settings (like 14 or 20 periods) are often too slow for 1-minute and 5-minute charts, leading to late entries and missed "alpha."
- Price Action is the Ultimate Signal: To eliminate lag, traders must prioritize raw candlestick data and volume-weighted tools like VWAP over traditional oscillators.
- Reframing the Strategy: Successful day trading requires using lagging indicators as a directional "filter" while using price action as the execution "trigger."
The Mathematical Reality: Why Technical Indicators Lag by Design
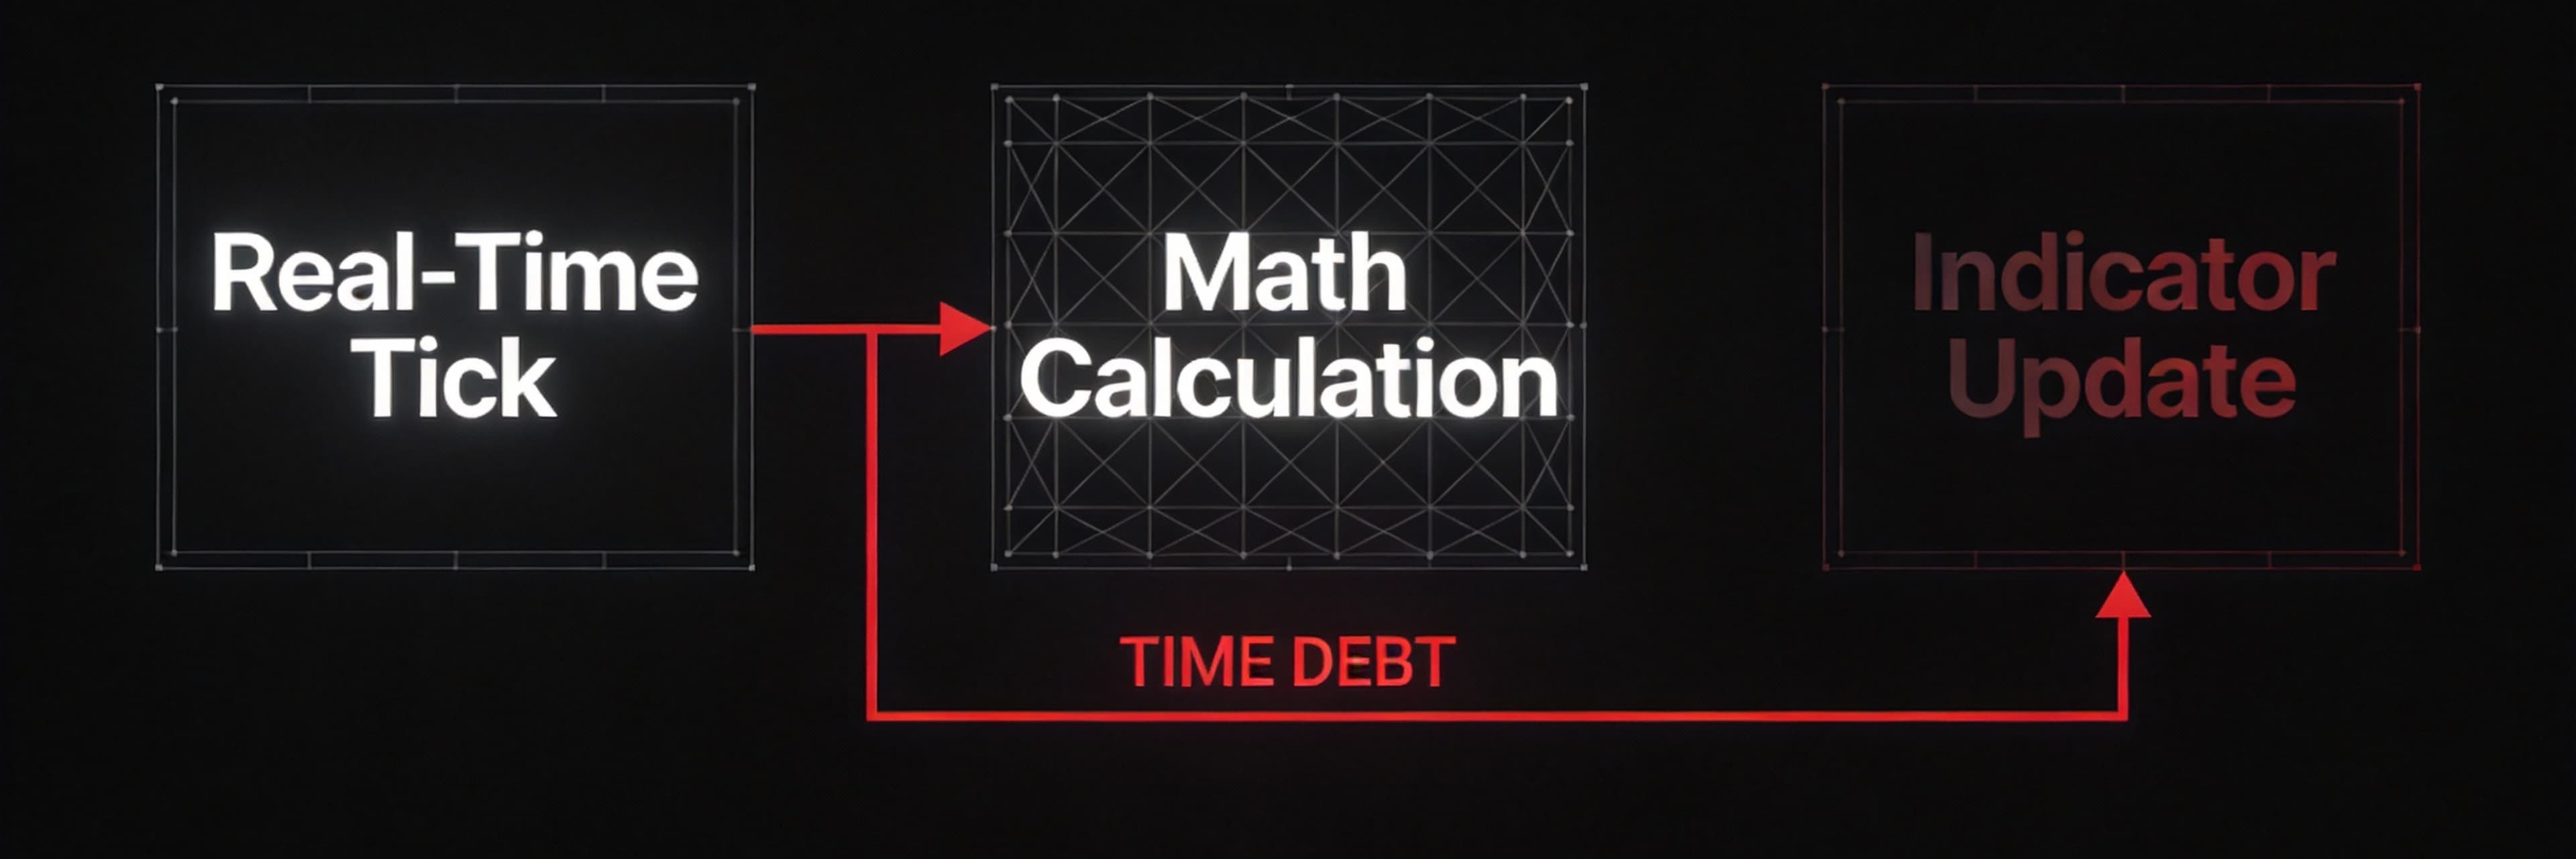
To understand why technical indicators lag in day trading, one must first accept a fundamental truth: every indicator you see on your screen is a mathematical transformation of price and time. They are not crystal balls; they are derivatives. Because these tools rely on historical price data to generate a signal, a "time debt" is created between the moment a price move occurs and the moment the indicator reflects that move.
The Derivative Nature of Technical Tools
Most retail traders view indicators as independent signals, but mathematically, they are secondary data points. Whether you are using a Simple Moving Average (SMA) or a complex Relative Strength Index (RSI), the formula requires a specific number of look-back periods to function.
For instance, a 20-period moving average cannot plot its next point until the current candle closes. This creates an inherent delay where the indicator is effectively reporting on "what just happened" rather than "what is happening now." Research into market theory suggests that even foundational frameworks like Dow Theory have an average lag in trend confirmation of approximately 15%. In a fast-paced day trading environment, missing the first 15% of a move can be the difference between a profitable trade and a late entry that gets caught in a reversal.
As noted by StockCharts ChartSchool, these overlays are essentially smoothed versions of reality, designed to filter noise but inevitably sacrificing timeliness in the process.
Why Lag is a Mathematical Necessity
Lag is not a software glitch or a flaw in your charting platform; it is a structural requirement for stability. Without lag, an indicator would be so sensitive to every tick that it would produce constant "noise," making it impossible to read.
The mathematical reality of lag is defined by several factors:
- Historical Dependency: Lagging indicators confirm existing trends by analyzing past prices. While this makes them more reliable for trend confirmation, it ensures the signal arrives after the optimal entry point.
- Smoothing Mechanisms: Tools like the Exponential Moving Average (EMA) or a Gaussian filter attempt to reduce noise by smoothing out price fluctuations. However, the more you smooth the data to avoid false signals, the more lag you introduce into the system.
- The Look-Back Trap: A longer look-back period provides a clearer picture of the long-term trend but increases the delay. Conversely, a shorter period reduces lag but increases the risk of "whipsaws" or fakeouts.
💡 Trader's Insight: If you are waiting for an indicator to tell you to enter, you are trading the past. Learn how to trade the present with Why 1-Minute Indicators Lag and How to Trade Visual Velocity.
The Impact on Risk-Reward Ratios
The primary danger of ignoring the mathematical lag of indicators is the compression of profit margins. When a trader waits for a "crossover" or a "breakout confirmation" from a lagging tool, the price has often already moved significantly toward the target.
This creates a dangerous asymmetry between risk and reward. Because the entry is late, the profit potential is smaller, yet the stop-loss must often remain wide to account for natural market volatility. Furthermore, in today's landscape dominated by high-frequency algorithmic trading, these mathematical delays are exploited by institutional programs that can react to price changes in microseconds, long before a standard retail indicator produces a "buy" signal.
Leading vs. Lagging Indicators: Understanding the Trade-off
In the fast-paced environment of day trading, the debate between leading and lagging indicators is central to developing a sustainable edge. To understand the root causes of trading frustration, one must grasp the fundamental trade-off between predictive speed and confirmatory accuracy. While both types of tools rely on historical data, they serve distinct roles—one attempts to forecast the future, while the other validates the present.
The Predictive Promise of Leading Indicators
Leading indicators, such as the RSI or Stochastics, function as "early warning systems." Much like how building permits act as a leading economic indicator by signaling future construction activity, leading technical indicators attempt to identify potential trend reversals or momentum shifts before they occur in the price.
- The Advantage: They provide early signals, allowing for tighter entries and potentially higher reward-to-risk ratios.
- The Risk: The primary trade-off is the frequency of false signals. Because these tools are sensitive to minor fluctuations, they often signal a reversal that never materializes, leading to "fakeouts."
The Confirmatory Strength of Lagging Indicators
Lagging indicators, such as the Simple Moving Average (SMA) or the MACD, are essentially a mathematical transformation of past prices. They do not attempt to predict where the price is going; instead, they confirm where the price has already been. Dhan's analysis of day trading tools highlights that while these are excellent for trend-following, their reactive nature is their greatest hurdle for scalpers.
- The Advantage: They offer high-conviction confirmation. By smoothing out market noise, they ensure you are trading in the direction of the established trend.
- The Risk: The cost of this certainty is speed. By the time a lagging indicator provides a signal, a significant portion of the price move has often already passed.
Balancing the Trade-off
Successful day traders often use a combination of these tools alongside price action. Leading indicators identify "areas of interest," while lagging indicators like VWAP or a Gaussian filter confirm the broader directional bias. Price action then serves as the ultimate "real-time" filter, bridging the gap between the predictive signal and the historical confirmation.
Why 1-Minute and 5-Minute Charts Amplify the 'Lag Effect'
For intraday traders, the 1-minute and 5-minute charts are the primary battlegrounds. However, these ultra-short timeframes are precisely where the "lag effect" becomes a costly reality. When you are operating in a high-volatility environment, the delay between a price move and an indicator signal isn't just a nuance; it is a structural failure.
The Math of the Look-Back Trap
Most standard indicators default to a 14 or 20-period look-back period. On a daily chart, 14 periods represent nearly three weeks of data. On a 1-minute chart, a 14-period indicator only looks back at the last 14 minutes.
The "Lag Effect" is amplified here because:
- Mathematical Transformation: By the time a 5-minute candle closes and the math is calculated, the "alpha" of a volatile move has often vanished.
- Sensitivity vs. Reliability: Shortening the look-back period to make the indicator faster increases the frequency of false signals. Keeping standard settings makes the indicator too slow to catch a scalp.
- Weighting Issues: SMAs treat the price from 20 minutes ago with the same importance as the price from 10 seconds ago. In day trading, this equal weighting is often a recipe for disaster.
📉 Timeframe Torture Test
| Feature | 1-Minute Chart (Scalping) | Daily Chart (Swing) |
|---|---|---|
| Look-Back (14 Period) | 14 Minutes (Too slow for volatility) | 14 Days (Good for trend) |
| Signal Lag Impact | Critical (Missed 80% of move) | Manageable (Missed 10% of move) |
| Noise Level | Extreme (Requires filtering) | Low (Natural smoothing) |
| Ideal Tool | Price Action / VWAP | Moving Averages / MACD |
The Triple Exponential Trap: Common Indicators That Fail in Fast Markets
It is a painful rite of passage: you wait for the "perfect" setup, the MACD crossover finally triggers, and you click "buy"—only to watch the price instantly reverse. This is the Triple Exponential Trap. In fast-moving markets, relying blindly on lagging indicators often forces retail traders to enter a position at the exact moment the move is exhausting itself.
The Retail Trader’s "Hall of Shame"
Certain indicators are notorious for "trapping" traders into buying the top or selling the bottom:
- MACD Crossovers: By the time the fast line crosses the slow line, the bulk of momentum has often passed. Traders are frequently "buying the peak" of a temporary spike.
- Overbought/Oversold Oscillators (RSI): A market can remain "overbought" for hours during a strong trend. Selling just because a line crossed "70" without volume confluence is a common mistake.
- Simple Moving Averages (SMA): The limitations of moving averages are most apparent in intraday trading; they are often too slow to react to sudden news-driven shifts.
How to Reduce Lag: From TEMA to Gaussian Filters
Understanding the delay is only half the battle; the second step is actively mitigating it. Since indicators rely on historical price data, they inherently wait for a candle to close. However, by optimizing the mathematical transformation of that data, traders can significantly sharpen their entries.
Triple Exponential Moving Average (TEMA)
Developed by Patrick Mulloy, the TEMA uses a complex triple-calculation method that effectively cancels out the inherent lag of the moving average itself. It calculates multiple EMAs and subtracts the "lag" component. This allows it to stay much tighter to the current price action than a standard SMA or EMA.
Gaussian Filters: Smoothness Meets Responsiveness
While many traders struggle with "choppy" signals, Gaussian filters offer a sophisticated alternative. Drawing inspiration from signal processing, Gaussian filters in trading apply a bell-curve weight to price data. Unlike a standard moving average that treats all data within a window equally, a Gaussian filter prioritizes the most relevant data points, creating a "smooth" line that doesn't "overshoot" the price.
Practical Adjustments
To effectively reduce the load on your decision-making process:
- Shorten Look-Back Periods: While it increases noise, it provides faster alerts for momentum bursts.
- Incorporate VWAP: Unlike time-based indicators, VWAP incorporates volume, providing a real-time benchmark of where the "smart money" is trading.
- Avoid Over-Smoothing: Over-smoothing your charts with too many filters can lead to a "perfect" looking line that is so delayed it becomes useless for execution.
The Ultimate Lag-Killer: Combining Price Action with VWAP
If you are tired of watching your MACD crossover happen three candles late, it is time to pivot to the "lag-killer" duo: price action and VWAP. While standard oscillators rely on a derivative of price, price action represents the raw, unfiltered reality of the market in real-time.
The Power of Real-Time Market Sentiment
VWAP (Volume-Weighted Average Price) incorporates volume, which is a critical distinction. Because institutions use VWAP as a benchmark, the line acts as a benchmark for "fair value." When you combine price action—the study of candlestick patterns and shadows—with VWAP, you are observing the actual supply and demand balance.
- Immediate Context: Prices above VWAP are intraday bullish; prices below are bearish.
- Institutional Footprints: Large players seek liquidity at VWAP, making it a dynamic support or resistance zone.
- Reduced Noise: While a Gaussian filter tries to hide volatility, price action embraces it, showing you the rejection shadows that signal a reversal before an indicator can recalculate.
As noted in various trading forums, the shift from time-based indicators to volume-weighted tools is often the turning point for professional consistency.
Practical Strategy: Using Lag as a Filter, Not a Trigger

To stop being a victim of late entries, you must undergo a fundamental shift: Use lagging indicators to identify the environment (the filter) and price action to identify the moment (the trigger).
The "Filter vs. Trigger" Framework
Think of your indicators as a compass and price action as your binoculars. A compass tells you the general direction (the trend), but it won't warn you about the tree immediately in front of you.
- The Filter (Lagging Indicators): Use tools like VWAP or long-term Moving Averages to define the market's "bias." If the price is above the VWAP, your filter is "Bullish." You only look for long setups.
- The Trigger (Price Action): Once the filter confirms the direction, wait for a real-time price action signal—such as an engulfing pattern or a break of a local high—to execute.
Why This Strategy Mitigates Lag
By the time a Gaussian filter smooths out the noise to give you a signal, the "meat" of the move is often over. If you wait for the indicator to "trigger" the trade, you enter at the tail end of a cycle. However, when you use these tools as a filter, the look-back periods work in your favor by providing a stable "base" of information.
In the competitive world of day trading, when you act matters more than what you believe. Markets are not just lines on a graph; they are queues and clocks. By using lag as a filter, you position yourself to be ready before the trigger occurs, moving from "prediction" to "strategic positioning."
FAQ
1. Can I completely eliminate lag from my trading indicators?
No, it is mathematically impossible to eliminate lag entirely from technical indicators because they are all derivatives of historical price and time. However, you can mitigate lag by using more responsive tools like TEMA or by prioritizing real-time data like price action and volume.
2. Is a 1-minute chart better than a 5-minute chart for reducing lag?
A shorter timeframe makes indicators react faster to price changes, but it also significantly increases "noise" and false signals. The "lag" is reduced, but the "reliability" is also compromised. Most professionals use the 1-minute chart for execution and the 5-minute or 15-minute chart for trend confirmation.
3. Why is VWAP considered less "laggy" than a Simple Moving Average?
While VWAP still uses historical data, it incorporates volume. This adds a layer of real-time market participation data that time-only averages lack. Because institutions use VWAP as a benchmark, the price often reacts to it immediately, making it a more "live" indicator of support and resistance.
4. What is the best "leading" indicator for a beginner?
Price action is the only true leading indicator. For those looking for technical tools, oscillators like the RSI are often called "leading," but they are prone to false signals. Beginners should focus on learning candlestick patterns and volume profiles as their primary leading tools.
5. Should I stop using MACD and RSI entirely?
Not necessarily. These tools are excellent for identifying broad momentum and divergences (where price makes a new high but the indicator does not). The key is to stop using them as "entry triggers" and start using them as "contextual filters" to support your price action analysis.
Related Reading
This article is part of our comprehensive guide: Trading Psychology for High-Frequency Scalping: The Complete Mental Discipline Guide.
Discover why 90% of scalpers fail psychologically, the 5 core mental traps destroying traders, and the architectural solutions that eliminate discipline failure without relying on willpower.