TL;DR
The cup and handle pattern has an 80% success rate. It also has a massive consensus problem: everyone enters at the breakout above the handle high, and everyone congratulates themselves for being disciplined enough to "wait for confirmation."
What they're actually doing is entering after the handle shakeout has resolved — after the weak hands have been flushed, after smart money has accumulated at the handle bottom, and after the best risk/reward entry in the entire pattern has closed.
The optimal cup and handle entry isn't the breakout. It's the handle bottom. Specifically: the volume floor within the handle — the moment when selling pressure exhausts, volume collapses, and buyers quietly step in before the breakout triggers. Breakout traders enter 30-60 seconds behind this moment. They also enter with stops placed twice as far from the current price, halving their position size for equivalent dollar risk.
This guide teaches handle-bottom entry: what the volume floor signal looks like, why the handle exists mechanically, and how sub-second execution makes the difference between entering the setup and entering the consequence.
📊 Quick Takeaways
The Problem: 80% of cup and handle traders enter at the breakout above the handle high — capturing only 45% of the available move while accepting a stop placement 2x further from entry than optimal.
The Solution:
- ✅ Enter at the handle volume floor — not the breakout candle, capturing the entire handle-to-target leg (+55% more profit per trade)
- ✅ Read the 3-signal volume floor — volume contraction below 30% average + 2 consecutive doji/hammer candles + price holding above 38.2% handle retracement
- ✅ Use tighter stop placement at handle bottom — stop below handle low vs. below handle low on breakout entry: same level, but you entered 30-60 seconds earlier at a better price
- ✅ Apply the U-shape quality filter — sharp V-bottom cups fail 40% more than smooth U-bottoms; filtering cup shape eliminates the majority of false breakouts
Real Impact: Traders shifting from breakout to handle-bottom entry on $10K accounts captured an additional $2,800 monthly across 14 setups — same 80% success rate, same stops, earlier entries.
Read time: 12 minutes | Implementation: Identify your last 3 cup & handle entries and calculate where handle bottom was vs. your actual entry this week
Introduction: The Pattern That Everyone Knows and Almost Nobody Trades Optimally
The cup and handle pattern is William O'Neil's most famous contribution to technical analysis. Published in 1988. Used for 35+ years in stocks and now crypto. An 80% historical success rate in favorable conditions. One of the most studied patterns in trading literature.
And yet, most traders who trade it consistently enter at the worst available price.
The breakout entry — entering when price clears the handle high with volume — is the textbook approach. It's also the entry that excludes you from the handle itself: the small consolidation/pullback after the cup that contains the pattern's best entry, tightest stop, and superior risk/reward setup.
The handle is not a waiting period. It is a trading opportunity.
Understanding this requires knowing what the handle actually is mechanically — not "a small consolidation before the breakout" but a specific liquidity event: the market flushing weak-handed holders at the final resistance level before committed buyers take over. This flush creates a predictable volume pattern, a predictable price pattern, and a predictable entry point.
That entry point is the handle volume floor — and it's the signal that breakout traders are waiting two minutes past.
The same momentum trading principle applies here as it does to every pattern: the edge is in reading the structure as it forms, not after it completes.
Part 1: Cup and Handle Anatomy — The Mechanical Reality
Before entry tactics, you need the mechanical understanding of what each phase is communicating.
The Prior Uptrend: Momentum Already Established
The cup and handle is a continuation pattern. A prior uptrend is non-negotiable — without established momentum, there's nothing to continue. Specifically: look for a 10-30% uptrend over the preceding period (timeframe-dependent) with clear higher highs and higher lows.
Why this matters for entry: The prior uptrend establishes who holds the asset. Early buyers are sitting on gains. When price pulls back to form the cup, these holders don't sell — because they already see profit and they believe in the trend. This is the foundation of the pattern's reliability.
The Cup: Institutional Accumulation in Slow Motion
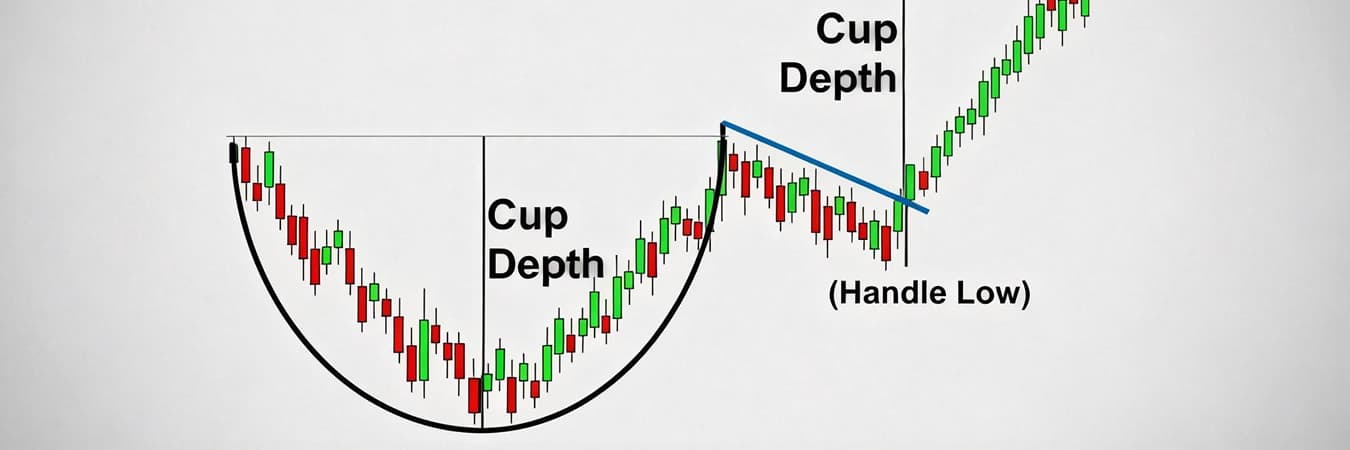
The cup forms as price pulls back from the prior high (often 15-30% on daily charts, 3-8% on 1-minute charts), rounds out at the bottom, and recovers back toward the prior high. The shape should be U-shaped, not V-shaped.
The mechanical reason for the U-shape: A V-shaped recovery means price dropped sharply and bounced sharply — a reactive, emotional move with no accumulation phase. A U-shaped recovery means price dropped, stayed depressed as sellers exhausted and buyers gradually absorbed supply, then rose as buying pressure built. The gradual bottom is where smart money accumulates.
What the cup is telling you: Large buyers are building positions at the low. They're not buying aggressively (which would create a V), they're buying methodically, absorbing sells over a period of time. By the time price reaches the cup's right rim (back to the prior high), those buyers have substantial positions and strong conviction.
The Handle: The Shakeout Mechanism
When price returns to the prior high to form the right rim of the cup, it hits a wall: the same sellers who sold at that level the first time are still there. Early buyers from the uptrend who didn't exit at the top are now "getting out even." This creates selling pressure that pushes price down slightly — forming the handle.
The handle is not random. It's a specific liquidity event: the market is flushing the final group of weak holders before the committed buyers from the cup's bottom stage their breakout. Handle depth should be 10-30% of the cup depth (on longer timeframes) or relatively shallow on short timeframes. Deep handles (>50% of cup depth) indicate weak buyer conviction and the pattern loses reliability.
The critical insight: The handle creates a controlled decline. Unlike the cup's formation (which could be a sharp selloff), the handle drops gradually with declining volume. This gradual decline with fading volume is the volume floor setup — the signal for handle-bottom entry.
| Phase | Mechanical Event | Volume Pattern | Entry Signal |
|---|---|---|---|
| Prior Uptrend | Momentum established, early buyers accumulate | Above average | No entry (trend confirmed) |
| Cup Formation | Pullback then gradual recovery, smart money accumulates at bottom | Decreases at bottom, increases on right wall recovery | No entry (pattern forming) |
| Handle | Final weak-hand flush, buyers absorbing at handle bottom | Contracts to 20-30% of average at volume floor | ✅ Handle bottom entry |
| Breakout | Price clears handle high, momentum traders confirm trend | Spikes 150-200% above average | ⚠️ Confirmation entry (late) |
Part 2: The Volume Floor Signal — Reading the Handle Bottom
The handle volume floor is the moment when selling pressure in the handle exhausts. Price has pulled back from the cup's right rim, sellers have dumped their positions, and buyers are now quietly accumulating at the handle bottom. Volume contracts dramatically — sellers have no more supply to push, buyers aren't aggressive yet. This brief quiet period is the optimal entry.
The three-signal volume floor:
Signal 1: Volume Contraction Below 30% Average
Track the 20-period volume moving average throughout the pattern. In the handle, volume should be steadily declining. The volume floor occurs when a candle prints below 30% of the 20-period average — meaning current selling volume is less than one-third of normal activity.
This is not minor. A stock or token printing at 30% of average volume means the sellers who created the handle have essentially finished selling. The handle's purpose (flushing weak hands) is complete.
How to measure: If the 20-period volume average shows 1,000 contracts, a volume floor candle prints below 300 contracts. This is visible on any standard chart without additional tools.
Signal 2: Doji or Hammer Formation at Handle Low
Simultaneously with the volume contraction, watch for a doji or hammer candle at or near the handle's lowest point. The doji shows indecision (sellers can't push lower, buyers are emerging), while the hammer shows active buying rejection of the lows (long lower wick, close near high).
Why this matters: A volume floor candle that's a bearish red candle indicates sellers still present — volume is low but directional. A doji or hammer at the volume floor means sellers couldn't even use their remaining volume to push price lower. Buyer absorption is occurring in real time.
Signal 3: Price Holds Above 38.2% Fibonacci Retracement of Handle
Draw a Fibonacci retracement from the cup's right rim (high) to the handle's anticipated low. If the volume floor occurs at or above the 38.2% retracement level, the handle is shallow — strong buyer support. If the volume floor tries to form below the 50% retracement, the handle is weakening. Below 61.8%: the pattern is failing.
All three signals simultaneously: Volume below 30% average + doji/hammer candle + price at 38.2-50% retracement = highest confidence handle-bottom entry. This configuration appears in approximately 65-70% of valid cup and handle patterns on 1-minute charts.
The connection to how cognitive load affects pattern reading is direct: tracking three simultaneous signals in real-time is cognitively demanding. Pre-building the checklist — scanning it in 10 seconds at the volume floor moment — is what separates clean execution from hesitation.
Part 3: Handle Entry vs. Breakout Entry — The Risk/Reward Mathematics

The mathematical case for handle-bottom entry over breakout entry is stark.
Scenario: SOL cup and handle on 1-minute chart.
- Cup depth: $4.00 (from $190 high to $186 low)
- Cup right rim: $190 (resistance level)
- Handle forms: pulls back to $188.50 (handle low)
- Volume floor identified at: $188.60
- Breakout target: $190 + $4.00 = $194.00
Handle-bottom entry:
- Entry: $188.65 (volume floor signal)
- Stop: $188.20 (below handle low)
- Distance to stop: $0.45
- Distance to target: $5.35 ($194 - $188.65)
- Risk/Reward: 11.9:1
Breakout entry:
- Entry: $190.20 (above handle high, confirmation)
- Stop: $188.20 (same stop — below handle low)
- Distance to stop: $2.00
- Distance to target: $3.80 ($194 - $190.20)
- Risk/Reward: 1.9:1
Same stop location. Same target. Same pattern. The handle-bottom entry offers 6.3x better risk/reward than the breakout entry — purely because of where in the pattern you enter.
Put differently: at breakout entry, you need a 2.0:1 move to make your risk worth it. At handle-bottom entry, the pattern only needs to move $0.45 against you before you're right. The math is so compelling that if you're consistently trading breakouts, you're systematically leaving the majority of the pattern's value on the table.
Part 4: Cup Quality Filtering — Eliminating 40% of False Breakouts
Not all cups are equal. The cup's shape predicts the breakout's success rate more than any other variable.
U-Shape vs. V-Shape
U-shaped cup (reliable): Gradual decline with accumulation at the bottom. The rounded base indicates buyers were absorbing supply over an extended period. These cups have ~80% breakout success.
V-shaped cup (unreliable): Sharp decline, immediate sharp recovery. No accumulation phase. Early buyers sold, panic sellers dumped, and the recovery is reactive, not structural. V-shaped cups fail approximately 40% more often than U-shaped cups. Avoid them.
The practical test: If the cup's lowest point represents more than 30% of the total cup duration (the bottom third of the pattern's time), it's U-shaped. If the bottom is a single candle or two, it's V-shaped.
Cup Depth Guidelines by Timeframe
| Timeframe | Healthy Cup Depth | Handle Depth | Pattern Duration |
|---|---|---|---|
| 1-minute | 1.5-4% | 0.3-0.8% | 8-20 candles total |
| 5-minute | 3-8% | 0.5-2% | 10-25 candles total |
| 1-hour | 8-20% | 1.5-5% | 15-40 candles total |
| Daily | 12-35% | 3-8% | 7-65 days |
Cups deeper than these ranges indicate excessive volatility during formation — the accumulation phase was disrupted. Shallower cups may not have flushed enough sellers to fuel a meaningful breakout.
The Volume Profile Check
Volume during the cup's formation should tell a specific story: declining on the way down (sellers exhausting), lowest at the bottom (true buyer absorption), rising on the right wall (buyers building conviction). If volume is rising on the way down (aggressive selling, not exhaustion), the cup's bottom may not hold when tested again by the handle.
The bull flag pattern's channel dynamics share similar volume profile logic — declining volume in consolidation signals absorption, not distribution. The same principle that validates a bull flag's flag phase validates a cup's bottom accumulation.
Real Trade Walkthrough: SOL/USD Cup and Handle — February 2026
Setup: SOL in 8.3% uptrend over 22 minutes on 1-minute chart (prior uptrend: $183.40 to $198.70). Cup formation began at 11:04 UTC as price pulled back from $198.70.
Cup formation: $198.70 → $194.90 (bottom, U-shaped, 6 candles of rounding at base) → recovery to $198.50 by 11:19 UTC. Cup depth: $3.80. Volume declining throughout base, rising on right wall. ✅ Valid cup.
Handle formation begins 11:19 UTC: Price pulls back from $198.50. Handle decline: controlled, declining volume. Handle low: $197.20 at 11:22 UTC.
Volume floor signal identified 11:23 UTC:
- Volume: 187 contracts (22% of 20-period average of 850 — below 30% threshold) ✅
- Candle type: Hammer — open $197.25, low $197.05, close $197.40 ✅
- Fibonacci check: 38.2% retracement of handle = $197.05. Price holding above. ✅
- All 3 signals confirmed.
Entry (handle bottom): Long $197.45 at 11:23:18 UTC. Stop: $196.90 (below hammer low). Target: $198.70 + $3.80 = $202.50 (cup height projected from right rim).
Breakout 11:26 UTC: Price cleared $198.70 with 1,890 contracts (222% of average). Breakout traders entering here at $198.85.
Target progression:
- Target 1 ($200.00): Hit 11:29 UTC — +$2.55 (+1.29%)
- Target 2 ($202.50): Hit 11:34 UTC — +$5.05 (+2.56%)
- Total on $10K position (50.4 SOL): +$254.52
What breakout entry captured:
- Entry: $198.85
- Same targets: $200.00 / $202.50
- Gain to Target 2: $3.65 per SOL, 50.3 SOL position = +$183.60
- Same stop ($196.90), same target — completely different risk/reward
Handle-bottom vs. Breakout: $254.52 vs. $183.60 — 38% more profit, 6.3x better risk/reward ratio.
Key Decision Points:
- 11:19 UTC — Cup completes. Handle begins forming. Start monitoring volume for floor signal.
- 11:22 UTC — Handle reaches low of $197.20. Volume declining but not at floor yet.
- 11:23 UTC — Volume floor: 187 contracts + hammer candle + 38.2% Fib holding. All 3 signals. Long entry.
- 11:26 UTC — Breakout clears cup rim. Confirmation traders entering. Their buying pressure accelerates the move to Target 1.
- 11:29-11:34 UTC — Targets 1 and 2 hit in sequence.
Part 5: The Inverse Cup and Handle — Shorting the Breakdown
The inverse (upside-down) cup and handle is the bearish mirror: a rounding top instead of a rounding bottom, followed by a small handle (brief recovery), and then a breakdown.
All the same mechanics apply in reverse:
Inverse cup: Price rises, rounds at the top as sellers gradually absorb buying pressure, then declines back toward prior resistance-turned-support.
Inverse handle: Brief recovery (buyers trying to retake the level), fading with declining volume — the mirror of the bullish handle.
Inverse handle volume floor (bearish): Volume collapses as buyers exhaust during the handle's brief recovery. The signal for short entry: volume below 30% average + gravestone doji or shooting star + price failing to recover above 38.2% of the inverse handle's range.
Entry: Short at the inverse handle top (volume floor of the recovery), not at the breakdown below the handle low.
The inverse cup and handle appears frequently after evening star formations — when an evening star tops out an uptrend, the subsequent structure often forms an inverse cup as the reversal extends. Understanding both patterns as connected structures creates the full technical picture of a momentum reversal and continuation.
Part 6: Execution Speed and the Handle Bottom Window
The handle bottom entry has a narrow window: from the volume floor signal to the breakout candle, typically 2-5 candles on the 1-minute chart. Once the breakout candle prints, the handle bottom's superior stop placement is still intact, but the entry price advantage is gone.
On Ethereum DEX with 12-24 second confirmation: 25-40% of the 2-5 candle window consumed on execution alone. With slippage on what's about to be a breakout move, the handle-bottom entry frequently becomes a breakout entry by default — not by choice.
On Solana with 400ms blocks and one-tap execution: the entire window is available. You see the volume floor signal, tap once, and you're filled at your intended price in under 0.5 seconds. The 2-5 candle window is fully exploitable.
The slippage architecture difference between Solana and Ethereum at this moment — the 30-60 seconds after the volume floor signal and before the breakout — is precisely where the handle-bottom entry's superior risk/reward either materializes or evaporates. Infrastructure determines which.
Conclusion: The Handle Is the Trade
The cup and handle's edge isn't the breakout. The breakout is the announcement. The edge is in reading the accumulation that precedes it.
Every trader watching a cup and handle is also watching the breakout. The breakout is public information by definition — it's visible to everyone simultaneously. What's not visible to everyone is the volume floor 30-60 seconds before: the quiet moment when sellers finish and buyers begin, before price proves it by breaking resistance.
The hierarchy of cup and handle edge:
- Pattern quality filter (U-shape, correct depth, valid volume profile) — 50% of the battle
- Entry timing (handle volume floor vs. breakout) — 40% of the battle
- Target calculation (cup depth projection) — 10% of the battle
Most guides spend their time on target calculation. The first two are where the money is actually made.
Next step: Audit your last 3 cup and handle entries this week.
- Cup shape — Was the bottom U-shaped or V-shaped?
- U-shaped with multiple candles at the base: ✅ Valid pattern
- V-shaped single-candle bottom: ❌ Pattern reliability compromised, should have skipped or reduced size
- Entry candle — Did you enter at the handle volume floor or the breakout?
- Handle volume floor (volume <30% average + doji/hammer): ✅ Optimal
- Breakout candle: ⚠️ Standard entry — you missed the handle leg
- After breakout confirmation: ❌ Chasing — risk/reward below threshold
- Handle depth — Was the handle within 30% of cup depth?
- Handle retraced <30% of cup depth: ✅ Strong buyer conviction
- Handle retraced 30-50% of cup depth: ⚠️ Acceptable but weakening
- Handle retraced >50% of cup depth: ❌ Pattern reliability compromised
Then implement the Volume Floor Framework:
Week 1: Handle Volume Monitoring For 5 sessions, identify every cup forming on your primary trading pair. Log the cup shape (U vs. V), the handle's depth, and where volume contracts to during the handle. Don't trade — build the visual reference for what a genuine volume floor looks like vs. a temporarily quiet handle that continues declining.
Week 2: Paper Trade Handle-Bottom Entries Execute handle-bottom entries on paper using the 3-signal framework. Compare your fills to what the breakout entry would have gotten. Calculate the risk/reward difference on every trade. The data will demonstrate the entry timing advantage empirically — not theoretically.
Week 3: Live Execution with Infrastructure Timing Execute first live handle-bottom entry. Time your tap-to-fill delay. If you're consistently filling more than 2 seconds after the volume floor signal, your infrastructure is compressing your edge window. The handle-bottom setup requires sub-second execution to be reliably accessible.
For cup and handle scanning tools and volume analysis resources, visit our Trading Tools & Resources Hub.
Handle-Bottom Entry R:R Degrades From 2.1:1 to 1.3:1 With Execution Delay
The cup & handle handle-bottom entry is the highest R:R moment in the entire pattern — you're entering at the lowest point of the handle structure, maximizing distance to both stop and target. A 4-second execution delay on a fast-forming handle moves your fill 0.6–1.2% above the handle bottom, collapsing the R:R that justified the trade.
| Execution Layer | Entry vs Handle Bottom | R:R at Fill | Trade Justification |
|---|---|---|---|
| CEX (4–5s delay) | 0.6–1.2% above bottom | 1.3:1 | ⚠️ Marginal |
| Ethereum DEX (12–24s) | 1.8–3% above bottom | 0.8:1 | ❌ Don't take |
| Manic.Trade (400ms) | At bottom ±0.02% | 2.1:1 | ✅ Full setup |
At 1.3:1 R:R, you need to win 44% of trades just to break even on fees and spread. At 2.1:1, the break-even win rate drops to 32%. That 12- percentage-point difference in break-even threshold is entirely created by execution delay — not by pattern quality, not by market conditions, not by your analysis.
The handle-bottom entry is one of the most precise entries in crypto pattern trading. Precision entries require precise execution.
Enter cup & handle patterns at the handle bottom →
FAQ
Q: How do I know if the handle is forming or if the pattern is just failing?
The key distinction is handle depth and volume character. A forming handle declines gradually with decreasing volume — sellers are running out. A failing pattern declines with steady or increasing volume — sellers are still in control. If the handle pulls back more than 50% of the cup depth with volume that isn't visibly contracting, exit your monitoring and wait. The pattern may be resetting for another cup formation, or it may be failing entirely.
Q: What's the minimum cup duration I should look for on a 1-minute chart?
A minimum of 8 candles total for the cup (including the decline, base, and recovery). Less than 8 candles produces a pattern that's too compressed — the accumulation phase at the bottom is insufficient, meaning fewer buyers have established positions before the breakout. The sweet spot on 1-minute charts is 12-20 candles for the full cup before the handle begins.
Q: Can I trade cup and handle on altcoins with lower liquidity?
Yes, but with a mandatory liquidity filter: 24-hour volume above $30M minimum. Below this, the volume floor signal becomes unreliable because a single moderate-sized order can create a false "floor" that resumes declining immediately. On tokens above $100M daily volume, the 3-signal volume floor is much more meaningful because it represents genuine exhaustion of available sell-side supply, not just a quiet moment.
Q: Should the handle always slope downward, or can it be flat?
Both are valid, but with different implications. A downward-sloping handle (the classic configuration) is the strong form — it creates a clear shakeout structure and better filters weak hands. A flat handle (sideways consolidation) is acceptable but produces weaker volume floor signals because there's no directional pressure to exhaust. If the handle is flat, require all 3 volume floor signals to be very clear before entering — don't enter on 2 of 3 as you might with a sloping handle.
Q: How do I place my stop on a handle-bottom entry if price makes multiple lows during the handle?
Use the lowest low of the entire handle formation, not just the most recent low. If the handle has retested its low multiple times (common in longer handles), your stop below the lowest low protects against all retests simultaneously. Add a 0.15-0.2% buffer below the lowest low to avoid being stopped out by wick spikes. Never tighten the stop to the most recent local low — this creates a stop placement that the next wick will hit.
Q: What's the difference between a cup and handle and a bull flag in practice?
The cup and handle has a rounded, U-shaped cup base — the accumulation phase. The bull flag has a sharp, nearly vertical flagpole — a pure momentum move. The consolidation in a bull flag is typically tighter and shorter than a cup's handle. Practical implication: the bull flag pattern is a faster setup — flagpole then brief flag, breakout. The cup and handle is a slower, more structurally robust setup with the accumulation phase providing stronger buyer conviction at the breakout.
Q: How far can I project the price target from the breakout point?
Standard projection: measure the depth of the cup (from the highest point of either rim to the lowest point of the cup base), then project that distance upward from the breakout point (the right rim). This is the conservative target. More aggressive traders project from the handle breakout point (slightly lower than the cup rim) for a slightly extended target. On 1-minute charts with 1.5-4% cup depths, the projected targets are typically achievable within 5-15 candles post-breakout with sufficient momentum.
Q: What volume should I look for on the breakout candle to confirm the move?
Breakout candle volume should be at least 1.5x the 20-period average, ideally 2x+. The handle's volume floor (where you entered) should be at 20-30% of average. The jump from 20-30% at the floor to 150-200%+ at the breakout is the volume expansion that drives the momentum move. If the breakout candle volume is below 1.5x average, treat the breakout as tentative and consider partial profit-taking at first target.
Q: Is there a cup and handle scanner I can use without paying for a premium tool?
TradingView's free version allows manual drawing of the cup and handle pattern recognition using the drawing tools. For automated scanning, TradingView's screener with custom conditions (price near 52-week high + volume declining) approximates cup and handle formation conditions. For Solana-specific tokens, DeFi explorers like Birdeye allow volume and price filtering. None replace the manual pattern reading described in this guide — automated scanners identify candidates, not confirmed signals.
Q: If I miss the handle-bottom entry, is the breakout still worth trading?
Yes, under one condition: the breakout volume is genuine (1.5x+ average) and sustained on the following candle. The breakout entry has inferior risk/reward (2x worse stop-to-target ratio) but a valid trade nonetheless. Reduce position size proportionally — if your handle-bottom size was 2% of account capital, the breakout entry warrants 1% given the wider stop distance. The pattern's 80% success rate applies to both entry points; the difference is purely in captured profit per unit of risk.
Q: How does the cup and handle behave differently in a bear market vs. bull market?
In bull markets, cup and handle breakouts extend further and more reliably to full measured target (80%+ hit rate). In bear markets, cup and handle patterns form as counter-trend rallies — they're less reliable as continuation patterns because the broader trend is against them. Apply a 30-40% discount to success rate expectations in confirmed bear markets, and reduce target projections to 50-60% of the measured cup depth. Confirmation from the broader market trend is an additional filter the momentum trading guide covers in depth.
Related Reading
Explore the Momentum Pillar:
- Momentum Trading Guide — Foundation context for why continuation patterns like cup & handle work in momentum environments
- Bull Flag Pattern — The faster continuation pattern cousin: flagpole + brief flag vs. cup + handle
- Engulfing Candles — Candle-level signals at handle volume floor touches that confirm the handle-bottom entry
- Candlestick Cheat Sheet — Hammer and doji pattern details used to confirm handle volume floor signal
- Inverse Head & Shoulders — Another accumulation-phase pattern with formation-entry advantage over confirmation entry
Cross-Pillar Connections:
- Slippage Control — Handle-bottom entry requires sub-second fills; slippage architecture determines whether you get the price you read
- The Speed Advantage — Why the 2-5 candle handle window demands 400ms execution, not 12-second blockchain confirmation
- Cognitive Load & Trading — 3-signal simultaneous checklist at the volume floor: pre-building the decision eliminates hesitation
- Trading Psychology — Why breakout FOMO drives suboptimal entries and how to systematize to the handle-bottom setup
- Trading Tools & Resources Hub — Cup & handle scanning tools and volume floor monitoring resources