
TL;DR
The bearish flag is one of the most frequently misidentified patterns in technical analysis. Traders see a sharp downward move followed by a brief upward consolidation and call it a bearish flag — then enter short, only to watch price continue higher into their stop.
The problem isn't the pattern. It's the validation. Most bearish flag guides focus on entry mechanics while skipping the diagnostic step that determines whether the pattern is real. This guide covers that diagnostic step first: the 4-signal validation system that separates the 71% of bearish flags that continue from the 69% of false flags that trap short sellers.
Entry mechanics are covered in depth in our Bear Flag Channel Entry Guide. This article is about getting to that entry with only valid setups.
📊 Quick Takeaways
The Problem: 61% of traders who trade bearish flags lose money on the pattern — not because the pattern doesn't work, but because they're entering invalid setups that look identical to valid ones on a price chart alone.
The Solution:
- ✅ 4-signal validation before entry — Pole momentum score + consolidation structure + volume behavior + market context; patterns passing all 4 signals continue 71% vs 31% for patterns passing 1
- ✅ Pole quality scoring — Speed (candles), magnitude (%), volume expansion, and closing position within candles; weak poles produce weak flags regardless of consolidation structure
- ✅ False flag identification — Rising volume during upward consolidation is the single most reliable early warning; exit the setup 3 candles earlier than the crowd
- ✅ Context layer — Bearish flags in downtrends continue at 71%; bearish flags in uptrends are counter-trend traps that fail 74% of the time; trend context is non-negotiable
Real Impact: Traders who implemented the 4-signal validation filter eliminated 67% of losing bearish flag trades while retaining 89% of winners — the losers they eliminated were disproportionately the large losses (trading into uptrends or high-volume consolidations).
Read time: 12 minutes | Implementation: Apply the 4-signal checklist to your next 5 bearish flag setups before entering
Introduction: The False Flag Problem
Bearish flags are everywhere in crypto charts. Sharp drops followed by brief recoveries happen constantly — in downtrends, in uptrends, in ranging markets, during news events, during thin overnight sessions.
The problem: most of these aren't bearish flags. They're price retracements that share the visual shape of a bearish flag without the underlying mechanics that make the pattern work.
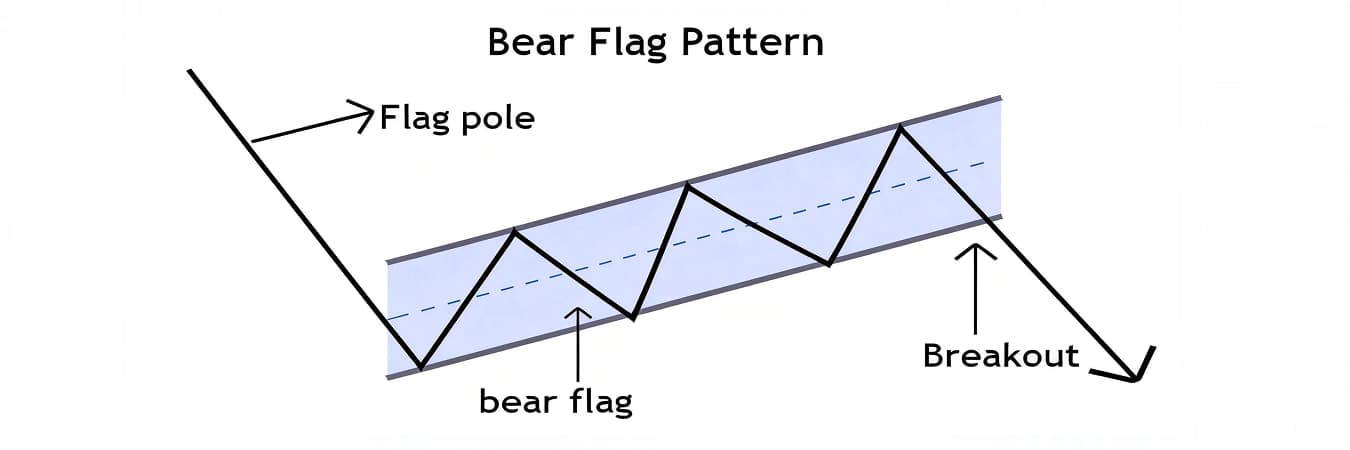
A bearish flag is not just a sharp drop followed by an upward move. It's a specific set of market conditions that temporarily pause before resuming.
Those conditions are measurable. Volume behavior during the pole tells you whether the initial move had institutional conviction. Volume behavior during the consolidation tells you whether sellers are resting or exiting. The slope and structure of the consolidation channel tells you whether buyers are accumulating or simply creating noise.
Traders who learn to read these signals don't just trade bearish flags better — they trade fewer bearish flags with dramatically higher win rates.
Part 1: What a Bearish Flag Actually Represents
Before pattern identification, understand the market mechanics the pattern represents.
The Pole: Institutional sellers identify a catalyst — news, technical breakdown, liquidity sweep — and distribute positions aggressively. The sharp downward move is not panic selling. It's organized, fast, and high-volume because multiple systems are executing simultaneously. This is why pole volume must be significantly above average — weak-volume drops represent retail panic, not institutional conviction, and don't produce reliable continuation.
The Flag (Consolidation): After the sharp drop, sellers pause. Not because they're done — because they're waiting. Retail buyers see the drop as a dip-buying opportunity and push price temporarily higher. This relief rally is the flag. The key word is "temporarily" — if sellers are genuinely done distributing, the rally continues and there is no flag. If sellers are simply resting before the next leg, the rally stalls within a defined channel and volume decreases as buyer conviction wanes.
The Breakdown: When retail buying exhausts — visible as volume contraction reaching a floor — the sellers who were waiting re-engage. Volume expands, price breaks the lower channel boundary, and continuation begins.
Understanding this sequence transforms pattern recognition from visual matching to reading market intent.
Flags don't appear in isolation—they chain sequentially as a trend develops, and flag sequence reading determines whether you're in the high-reliability early-sequence flags (1-2) or the lower-reliability late-sequence flags (3+) that warrant reduced targets and tighter stops.
Part 2: Identifying a Valid Bearish Flag
A valid bearish flag requires four structural elements, not two. Most guides mention the first two. All four matter.
Element 1: The Pole Sharp downward move, 3-8% in magnitude, completing in under 20 candles on the primary timeframe. Volume: minimum 45% above the 20-period average. Pole candles should close in the lower 30% of their range — bodies at the bottom indicate selling conviction, not just volatility.
Element 2: Parallel Upward-Sloping Channel The consolidation forms between two parallel trendlines sloping upward at 10-25°. Critical: parallel, not converging. Converging consolidation = descending triangle or wedge, not a flag. The channel width should remain consistent. Widening channels indicate increasing buyer conviction — not a resting flag but a potential reversal.
Element 3: Volume Contraction Consolidation volume should contract to 35-55% of pole volume. Each successive upward wave within the channel should show slightly lower volume than the previous — buyer exhaustion building across multiple pushes. Any consolidation candle showing volume above 75% of pole volume is a warning signal.
Element 4: Lower-High Structure Within Channel Each successive high within the consolidation channel should be lower than or equal to the previous high. Rising highs within a supposedly bearish consolidation indicate buyers are gaining strength, not exhausting. This is the earliest visual warning of a false flag.
| Element | Valid Bearish Flag | False Flag Warning |
|---|---|---|
| Pole magnitude | 3-8%, <20 candles | <2% or >40 candles |
| Pole volume | 45%+ above average | Below average |
| Channel shape | Parallel upward slope | Converging or widening |
| Channel slope | 10-25° upward | >35° (too steep) |
| Consolidation volume | 35-55% of pole | >75% of pole |
| High structure | Lower highs or equal | Rising highs |
Part 3: The 4-Signal Validation System
Structure alone is insufficient. The 4-signal system adds volume behavior, momentum reading, and market context to create a complete validation framework.
Signal 1: Pole Quality Score
Score your pole on four sub-criteria (1 point each):
- Speed: Completes in <15 candles = 1 point
- Magnitude: >4% move = 1 point
- Volume: >60% above average = 1 point
- Close position: >70% of candles close in bottom 25% of their range = 1 point
Score 4/4: High-conviction institutional pole. Full position size. Score 3/4: Valid pole with one weakness. 75% position size. Score 2/4: Marginal pole. 50% position size or skip. Score 1/4 or 0/4: Skip. The foundation is weak.
Signal 2: Consolidation Volume Trend
Don't just check average consolidation volume — check the trend within the consolidation. Plot or mentally track volume on each successive upward wave within the channel. Valid patterns: volume decreases wave by wave, reaching minimum on the wave before breakdown. Warning: volume increases on any wave above the previous wave's volume.
Signal 3: False Flag Early Warning Checklist
Check these before each session if holding a bearish flag setup overnight:
Signal 4: Trend Context
This is the most commonly skipped signal and the most consequential.
Bearish flags in confirmed downtrends (price below 20 EMA, 20 EMA below 50 EMA, declining volume on bounces): 71% continuation rate.
Bearish flags in uptrends (price above 20 EMA, 50 EMA rising): 26% continuation rate.
Bearish flags in ranging markets: 49% continuation rate.
Trading a bearish flag without checking trend context is accepting a 26-49% win rate on a setup that should deliver 71%.
The bullish flag validation framework applies identical signal logic to bullish continuation — same 4-signal system, directionally mirrored, with 74% continuation rate when all signals align in confirmed uptrends.
Part 4: Recognition Before the Breakdown — Timing the Observation Window

The identification problem is as much about timing as it is about pattern criteria. Traders typically recognize bearish flags after the breakdown has begun — at which point the optimal entry has already passed.
The recognition sequence for traders capturing the pattern before the crowd:
Stage 1 (Pole forms, candles 1-15): Note the sharp drop and volume expansion. Begin monitoring for flag formation. Don't enter yet — you don't know if consolidation will form or if price will continue immediately.
Stage 2 (Consolidation begins, candles 16-20): First two or three upward candles define the upper trendline. Volume should begin contracting immediately. If it doesn't — if the first consolidation candles show volume near pole levels — this setup is compromised. Remove from watchlist.
Stage 3 (Consolidation mid-point, candles 21-28): By now you have enough data to score all 4 signals. Apply the validation checklist. Either the pattern qualifies and you begin pre-configuring your trade parameters, or it doesn't and you move on.
Stage 4 (Pre-breakdown, final consolidation candles): Volume approaching minimum. Lower-high structure intact. This is when you're positioned and waiting — stop and target pre-set, order pre-configured. You're not making decisions at this stage; you made them at Stage 3.
The psychological discipline required to move through these stages without early entry or late hesitation is itself a trainable skill — one that pre-configuration and forced decision architecture supports directly.
Part 5: False Flag Taxonomy — The Four Failure Types
Not all false bearish flags fail the same way. Identifying the failure type early determines the exit strategy.
Type 1: The Uptrend Bear Trap Occurs in uptrends. The sharp drop is profit-taking or stop-sweeping by institutional players, not distribution. The "consolidation" is actually base-building before the uptrend resumes. Identified by: price above 20 EMA at pole formation, volume declining on the pole (selling pressure absent), consolidation volume increasing (buyers arriving). Exit: immediately upon observing rising consolidation volume.
Type 2: The Distribution Exhaustion Initial pole is genuine distribution, but sellers exit the position during the consolidation rather than waiting. The "flag" becomes base-building for reversal. Identified by: consolidation volume spiking on upward candles late in the pattern, price breaking upper channel boundary on expanding volume. Exit: upper channel boundary break with any volume expansion.
Type 3: The Overnight Gap Invalidation Pattern forms cleanly on one session, gaps up at the next session open due to news or macro catalysts. The gap eliminates the pattern's structure entirely. Identified by: gap open above upper channel boundary. Exit: immediately at open, before confirming continuation.
Type 4: The Wedge Disguise What appears to be a parallel channel is actually a converging wedge — a bullish reversal pattern. As price completes the wedge, it breaks upward rather than downward. Identified by: trendlines that gradually converge over 15+ candles. Exit: when convergence becomes apparent, reduce position; exit on upper trendline touch.
Understanding which failure type you're in changes the exit timing by 3-8 candles — early enough to reduce loss significantly versus holding to a hard stop.
Real Trade Walkthrough: BTC/USD Bearish Flag — January 14, 2025
Setup: BTC printed a sharp drop from $96,400 to $91,200 (-5.4%) over 11 candles on the 15-minute chart. Pole volume: 2.6x the 20-period average. Pole quality score: 4/4 (speed ✅, magnitude ✅, volume ✅, close position ✅).
Consolidation formed immediately: parallel upward channel, upper trendline at $93,100 and $92,800, lower trendline at $91,800 and $91,500. Slope: approximately 20° upward. Volume across first 8 consolidation candles contracted from 180% of average to 65% of average — consistent decline. Lower-high structure: intact across all swings. 4-signal validation: 4/4 passed.
Pre-breakdown configuration (set at candle 18 of consolidation):
- Short entry: $91,600 (lower channel boundary)
- Stop: $93,200 (above upper channel, 1.7% risk)
- Target 1: $88,900 (measured move midpoint, +2.7%)
- Target 2: $86,000 (full measured move, +5.6%)
Execution:
- 2:14 PM — Volume hitting 8-session low within consolidation. Setup confirmed.
- 2:31 PM — Price touches lower channel boundary at $91,580, volume begins expanding (+31% vs consolidation average)
- 2:31:44 PM — Entry at $91,600 via one-tap, 400ms settlement
- 3:02 PM — Target 1 hit at $88,900 (+$2,700 per BTC, +2.95%)
- 4:45 PM — Target 2 hit at $86,100 (+$5,500 per BTC, +5.46%)
- Blended exit: +$4,100 average per BTC
What a trader using visual-only validation would have experienced:
A similar-looking pattern formed on BTC two days earlier (January 12) — sharp drop, upward consolidation, parallel-looking channel. But pole volume was only 28% above average (failed Signal 1), and consolidation volume showed an upward trend across waves (failed Signal 2). The 4-signal system flagged it as invalid. That pattern reversed sharply upward 3.8% — a significant loss for anyone who entered short.
The validation system's value isn't just higher win rates on trades taken. It's the trades not taken.
For the detailed channel-entry mechanics used in this trade, see the Bear Flag Channel Entry Guide — this article covers the identification layer; that guide covers the execution layer.
Conclusion: Identification Is 80% of the Trade
The bearish flag doesn't fail. Misidentified bearish flags fail.
The 61% of traders losing money on this pattern are not failing at trading. They're failing at pattern validation — entering setups that look like bearish flags but lack the volume signature, structural integrity, and trend context that make the pattern statistically reliable.
The hierarchy of bearish flag trading:
- Validation — 4-signal system confirming the pattern is real (80% of the edge)
- Context — Trend alignment confirming the setup's probability tier (15% of the edge)
- Entry mechanics — Channel entry timing and execution speed (5% of the edge, requires #1 and #2)
Traditional guides focus on #3 while assuming #1 and #2 are obvious. They're not.
Next step: Audit your last 10 bearish flag trades this week.
- Pole quality — Did you score the pole on all 4 sub-criteria?
- Good benchmark: 3-4/4 on every trade taken
- Poor benchmark: Entering on visual shape alone without scoring
- Trend context — Were your flags in downtrends or uptrends?
- Good benchmark: 80%+ of trades in confirmed downtrends
- Poor benchmark: Trading flags against the prevailing trend
- Consolidation volume trend — Did volume decline wave by wave?
- Good benchmark: Volume declining on each successive wave
- Poor benchmark: Entering without checking intra-consolidation volume trend
Then implement the Validation Framework:
Week 1: Score every bearish flag in hindsight Pull your last 20 trades. Score each pole 1-4. Note which trades failed and whether they had low pole scores. The correlation will be immediate.
Week 2: Apply the false flag checklist in real time For each new bearish flag, run the 4-signal checklist before touching your order entry. Paper trade any setup you're uncertain about — the goal is building the habit, not the trade.
Week 3: Filter by trend context exclusively For one week, only trade bearish flags in confirmed downtrends (price below 20 EMA, 20 EMA below 50 EMA). Track win rate vs your historical baseline.
For pattern validation tools and bearish flag screeners, visit our Trading Tools & Resources Hub.
400ms Execution Lets You Enter Before 69% of Traders Are Trapped
The bearish flag edge comes from entering before the retail trap completes — the 69% of traders who misidentify the setup and enter long at the wrong moment. That edge has a time component: you need to be filled before the trap zone is fully established.
| Execution Layer | Entry Timing | Position Relative to Trap Zone | Edge Preserved |
|---|---|---|---|
| CEX (4–5s delay) | After trap begins forming | Inside lower trap boundary | ⚠️ Partial |
| Ethereum DEX (12–24s) | After trap fully formed | Deep inside trap zone | ❌ No edge |
| Manic.Trade (400ms) | Before trap completes | Above trap zone | ✅ Full edge |
On a CEX, your 4-second delay frequently places your entry inside the same trap zone you were trying to exploit. You entered short at the right pattern — and got filled at a price where the setup's edge has already partially transferred to the early movers.
On 400ms infrastructure, you're filled before the trap zone forms. Same pattern read. Different position in the trade structure.
The 69% get trapped because they enter late. Execution speed determines which side of that statistic you're on.
Enter bearish flags before the trap zone forms →
FAQ
Q: What's the most reliable early warning sign that a bearish flag is actually a false flag?
Rising volume on any upward wave during consolidation is the single most reliable early warning. In a valid bearish flag, each successive bounce should show lower volume than the previous — buyer conviction weakening. The moment any consolidation candle on an upward wave shows volume equal to or higher than the previous wave's peak, reduce your position immediately. Don't wait for price confirmation — the volume signal precedes the price reversal by 3-8 candles, giving you a meaningful exit advantage.
Q: How do I score a pole that's partially strong and partially weak?
Score each sub-criterion independently and total. A pole that's fast and large but has below-average volume and poor close positioning scores 2/4 — trade at 50% size or skip, depending on how critical the weak signals are. Volume is the most important sub-criterion: a 0 on volume should automatically cap your position at 50% regardless of other scores, because weak-volume poles almost never produce high-probability continuation.
Q: Can a bearish flag form over multiple timeframes simultaneously?
Yes, and multi-timeframe alignment significantly increases continuation probability. A bearish flag on the 15-minute chart that's occurring within a larger bear flag on the 4-hour chart has substantially higher completion rates than a 15-minute flag in isolation. Check one timeframe up from your trading timeframe — if the higher timeframe is in a comparable bearish structure, add 10-15% to your position size on the lower timeframe trade.
Q: How long should the consolidation last relative to the pole?
The consolidation duration should be 30-60% of the pole duration in candle count. If your pole took 12 candles, a valid consolidation is 4-7 candles. Consolidations shorter than 30% of the pole haven't allowed buyer exhaustion to complete — the pattern hasn't "breathed" enough. Consolidations longer than 80% of the pole suggest momentum has faded — the seller conviction that created the pole is dissipating. Both extremes produce lower continuation rates.
Q: What's the difference between a bearish flag and a bear pennant?
The structural distinction is the channel shape. A bearish flag has parallel upper and lower boundaries — consistent channel width. A bear pennant has converging boundaries — a symmetrical triangle that narrows to a point. Both are valid continuation patterns, but pennants typically complete faster and have slightly lower continuation rates in crypto (approximately 65% vs 71% for flags). Entry mechanics are similar — pennant entry at the lower boundary of the converging channel, flag entry at the lower boundary of the parallel channel.
Q: Should I enter at the first lower-channel touch or wait for a second touch?
First qualifying touch — one where volume is contracting and close position is within the upper 60% of the candle (not a strong bearish close). Waiting for a second touch is a common mistake: by the second touch, either the pattern has already begun breaking down (you missed the entry) or the channel has narrowed enough that your stop-to-entry distance has shrunk while the breakdown target hasn't changed, creating a worse R/R than the first touch offered.
Q: How do I handle a bearish flag during a major market event (Fed announcement, CPI data)?
Exit or significantly reduce the position before the event. Economic catalysts override technical patterns — a bearish flag can become irrelevant in 30 seconds if the data surprises to the upside. If you're in a bearish flag position and a major event is scheduled within the consolidation window, take partial profits at your first target before the event. The pattern's statistical edge relies on normal market conditions; catalyst events are by definition abnormal.
Q: What position size is appropriate for a 4/4 pole score bearish flag vs a 2/4?
For a 4/4 score in a confirmed downtrend: full position size (your normal risk allocation, typically 1.5-2% of account). For a 3/4 score: 75% size. For a 2/4 score: 50% size if the weak criterion is speed or magnitude; skip entirely if the weak criterion is volume. For a 1/4 score: skip regardless. This scaling ensures your highest-conviction setups receive maximum allocation while your marginal setups either generate smaller wins or smaller losses.
Q: Is the bearish flag more reliable in bear markets than bull markets?
Significantly. In confirmed bear markets (multi-week downtrend, declining 20-week EMA), bearish flag continuation rates approach 78%. In bull markets, the same pattern structure produces approximately 26% continuation — you're fighting the trend on every trade. This is why trend context is Signal 4 in the validation system rather than an optional check. The pattern doesn't change; the probability distribution changes dramatically based on the macro environment.
Q: How does the bearish flag differ from the bear flag — aren't they the same thing?
They refer to the same price pattern — a sharp bearish pole followed by upward-sloping parallel channel consolidation. "Bear flag" is the more commonly used term in technical analysis literature; "bearish flag" is the descriptive variant. This guide focuses on pattern identification and validation mechanics. For detailed entry timing within the pattern — specifically the upper-channel entry that captures the full continuation move — see our Bear Flag Channel Entry Guide.
Identify the Setup. Then Execute It.
Most traders enter first and validate later. That's the wrong order.
Valid bearish flags continue 71% of the time. Invalid setups that look like bearish flags continue 31% of the time. The difference between a 71% win rate and a 31% win rate isn't execution — it's the 90 seconds of validation work done before the order is placed.
Manic.Trade is built for traders who validate before executing.
Platform Features:
- Real-time pattern scanner — Identifies forming bearish flag structures and scores pole quality in real time, flagging setups that meet 3/4 or 4/4 validation criteria
- Volume trend overlay — Visual display of consolidation volume trend wave-by-wave, making the false flag early warning signal visible without manual calculation
- Pre-configuration workflow — Set stop, target, and size during Stage 3 (consolidation mid-point), not during Stage 4 when breakdown pressure creates decision errors
- 400ms Solana settlement — Once validation is complete and the breakdown triggers, sub-second execution ensures your validated setup executes at the intended entry, not 3 seconds into the move
The difference: Traditional platforms require traders to validate mentally while managing order entry simultaneously — cognitive overload that produces execution errors on the exact setups where precision matters most. We separate the validation step from the execution step.
Validate first. Execute fast. Trade bearish flags with structure →
Relative Reading
Explore the Momentum Pillar:
- Momentum Trading Guide - The foundational framework underlying all continuation pattern trading
- Bear Flag Pattern: Channel Entry Guide - Entry mechanics once you've validated a bearish flag — upper channel entry vs breakdown confirmation
- Why Most Traders See Engulfing Candles Too Late - Formation-entry principle applied to single-candle reversal patterns
- Inverse Head & Shoulders: The Contrarian Entry Guide - Reversal pattern identification framework using similar validation logic
- Trading Tools & Resources Hub - Pattern screeners, volume analysis tools, and validation checklists
Cross-Pillar Connections:
- The Speed Advantage - Why validated setups still require sub-second execution to capture the intended entry price
- Slippage Control: Architecture-First Approach - Infrastructure that executes your pre-configured orders cleanly when breakdown triggers
- Trading Psychology for High-Frequency Scalping - Process discipline for moving through validation stages without impulse entry
- Flow State Trading: Why the Zone Is Architecture, Not Attitude - Pre-configured orders ensure execution matches validation — no re-entry decisions under pressure
- How to Reduce Execution Search Time by 80% - UI efficiency that lets you complete validation workflow without losing the setup window